Join us in Toronto on November 26, 2024 for our next Rentsync Roadshow stop. Tickets are selling fast, get yours today!
Demand Report
Rentsync National Rental Demand Report: February
David Aizikov, February 13th 2023
Demand Trends for the Canadian Market:
In January, conventional market conditions were restored following the holiday slowdown. There was a surge of new activity as renters returned to the market, In addition to a gradual increase in property counts which made up for the losses in December. Despite prospects continuing to climb, their impact on overall property availability has been limited. This suggests that while overall demand remains strong, actual lease signings are down.
Unique prospects are up and more than makeup for the losses experienced in December +24.6% nationally month-over-month, properties are up +4.5%, and average prospects per property similarly trend upwards at +19.3% nationally. Rebounding from the December lull these figures do not directly suggest that the market has begun to rebound but are simply a return to conventional trends post-seasonal decline.
Although renter counts continue to increase relative to property counts, lease completions are gradually declining, suggesting that renter confidence in market fundamentals remains weak. Whether due to a lack of financial security, or households seemingly attempting to lessen the cost of housing by remaining in place, the market has begun to respond with average rental rates continuing to slow down post-2022.
Despite properties trending downwards, the market remains strong as rental demand has increased compared to January 2022. Additionally, although prospect counts have declined, the rate of decline has been lower, resulting in a 23% year-over-year increase in prospects per property. This stability should be considered as we continue to monitor market trends and demand in the near future.
Below we will identify notable changes in rental demand, highlight market-specific trends, and discuss what the coming months may look like for the rental demand in Canada.
Top 40 Canadian Cities in Demand
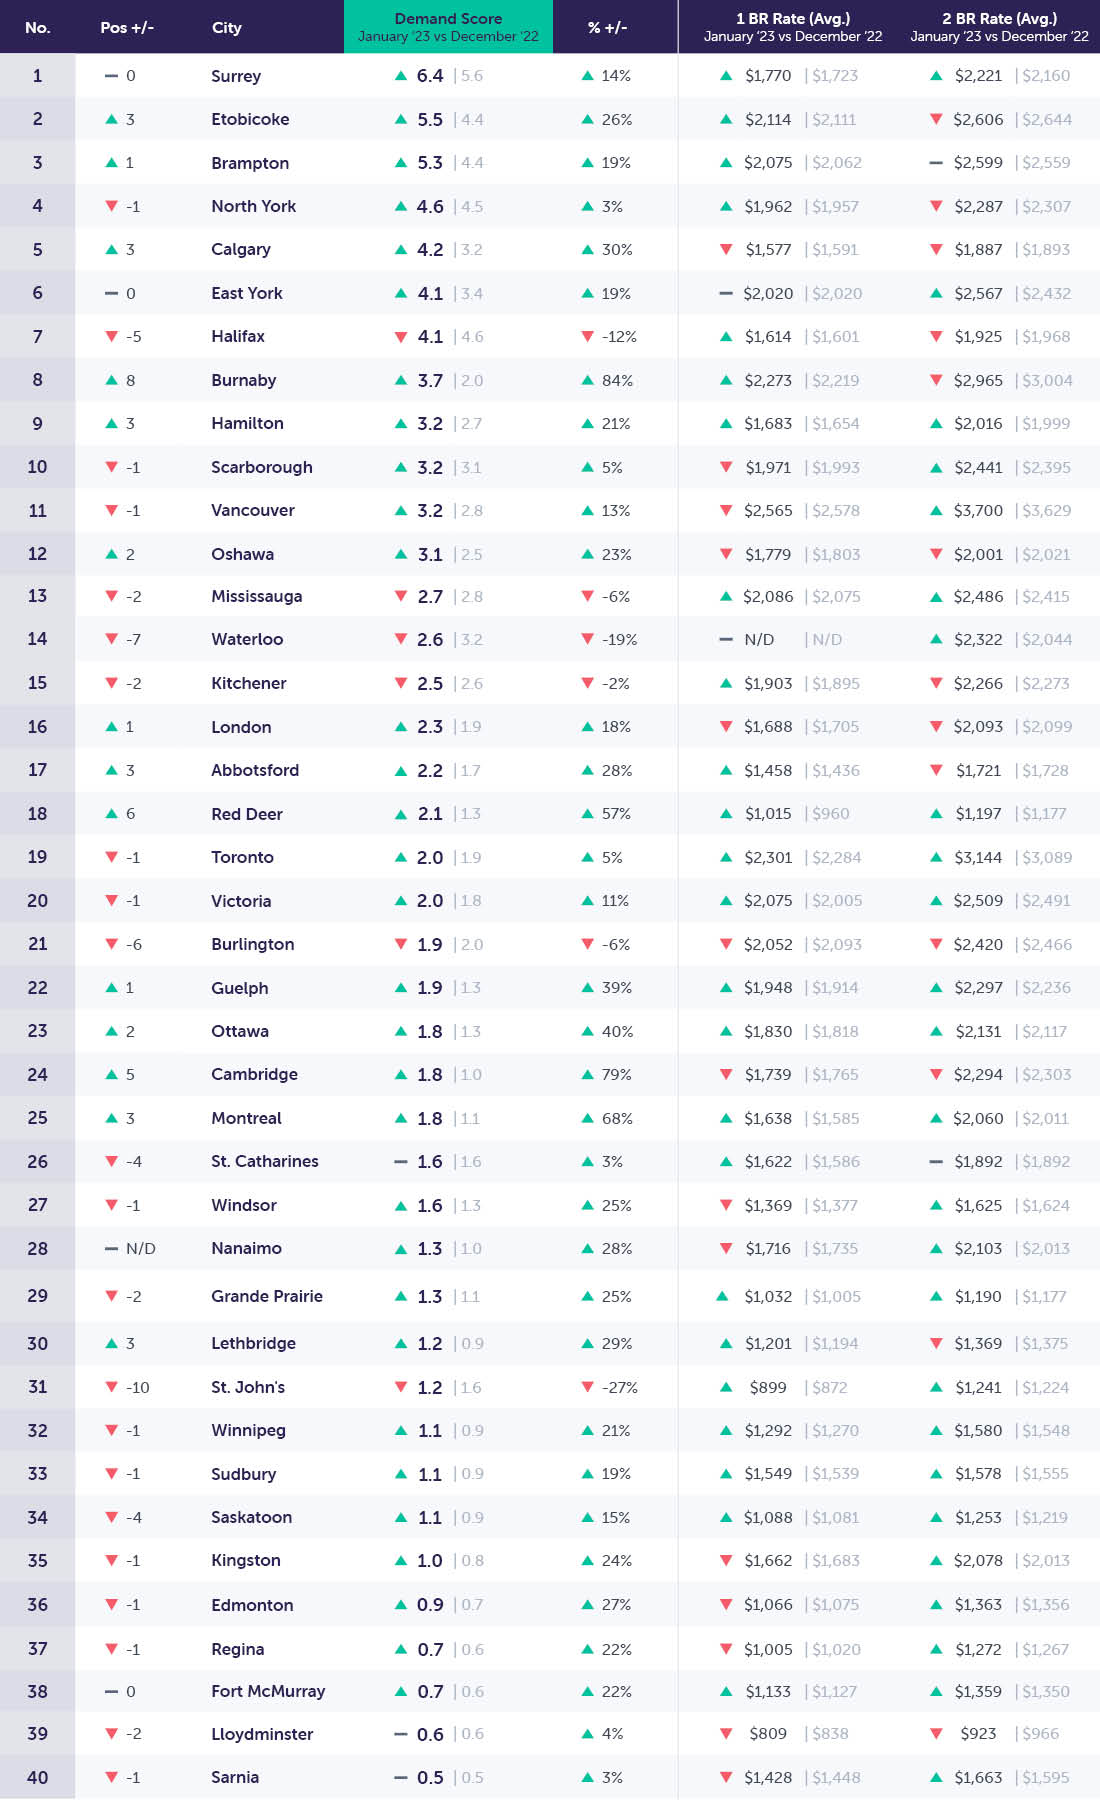
Notable Changes in Demand Over the Past Month
Demand has reversed after a post-seasonal decline with an average increase of +19.3% month-over-month. This rebounding represents a return to more conventional market conditions once the holiday season ended and people returned to their daily lives. Whether it be listing apartments available for rent, or actively searching for new rental accommodations, the market came back in full force. While the monthly demand growth is substantial it simply represents a return to demand levels seen as far back as November. It remains too early to determine whether this represents a return to growing demand figures, or simply a monthly rebounding after an exceptionally slow holiday decline.
Month-Over-Month (M/M)
- Primary: Demand scores are up +21%
- Secondary: Demand scores are up +14%
- Tertiary: Demand scores are up +27%
Month-over-month (M/M) National demand scores are up by +19.3% in January 2023 compared with December 2022. While this growth is substantial, it simply indicates a return to demand figures experienced before the seasonal holiday decline. Prospects are up 24.6%, and properties have rebounded making up for December’s losses and are up +4.5% month-over-month.
Year-Over-Year (Y/Y)
- Primary: Demand scores are down -16%
- Secondary: Demand scores are down -37%
- Tertiary: Demand scores are down -43%
Year-over-year (Y/Y): National demand scores are down -25.1% in January 2023 compared with January 2021. Demand scores continue to trend downwards annually for the third month in a row. Primarily due to the strong growth trajectory experienced at the end of 2021. leading into the strong maintained leasing period throughout 2022. Demand scores don't paint the full picture however as unique prospects per property are up +28.7% year-over-year which leaves properties in a much better position when competing for tenants as there is a greater imbalance between available properties and prospective tenants looking for housing. Overall market conditions remain strong and are not a reason for concern.
An Analysis of The Top 10 Canadian Markets:
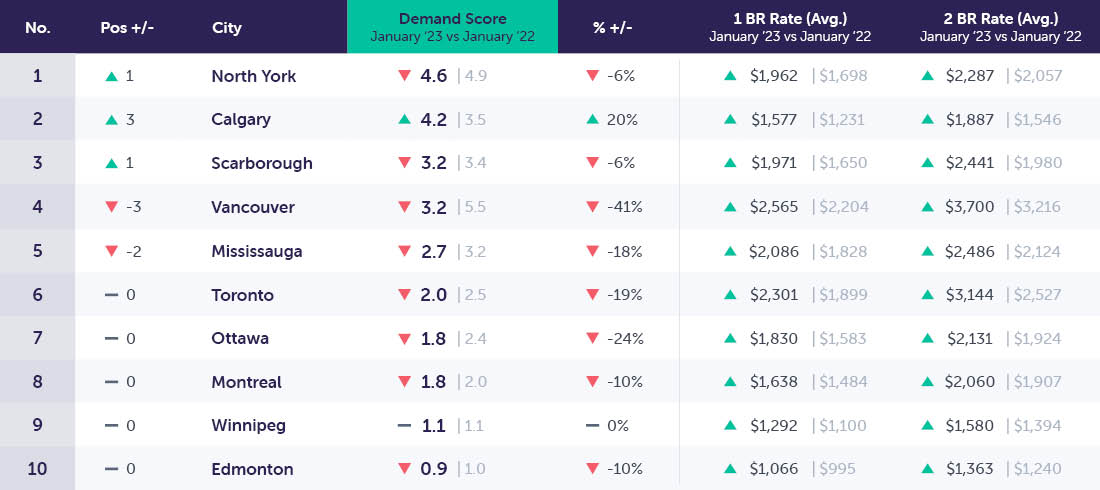
Top 10 Canadian Cities in Demand Drill Down (M/M): January 2023 vs. December 2022
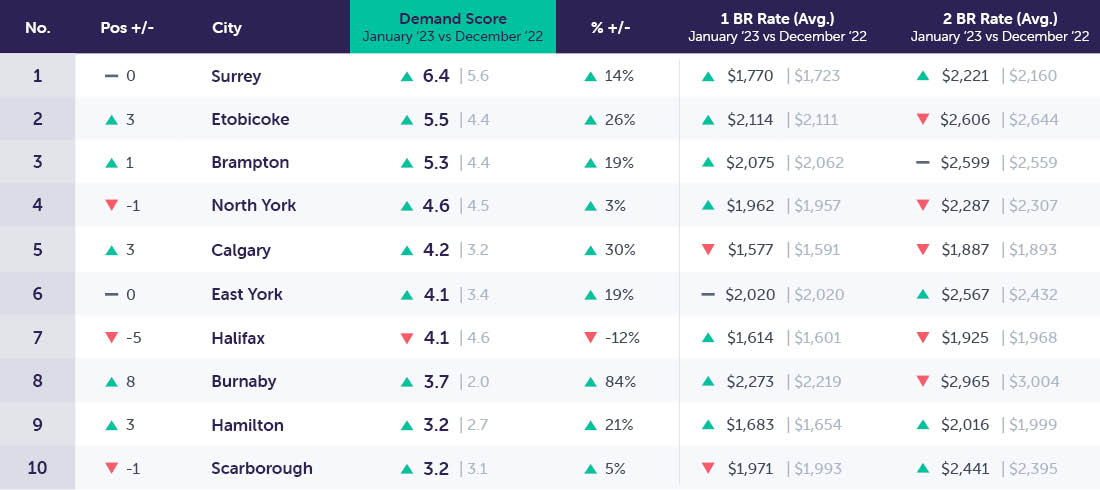
Key Trends for Top 10 Canadian Cities in Demand (M/M)
The top 10 markets underperformed relative to the national average likely due to a large number of secondary markets within this list. Demand scores increased an average of +18.8% month-over-month, unique prospects increased by +23.4%, and properties increased by +3.9%. Average rental rates have continued to hold with a monthly change of +0.6% for one-bedroom units and +0.04% for two-bedroom units. This represents the second month in a row of slowed growth in rental rates and although not directly indicative of a longer-term shift in rents it offers some reprieve for renters delaying a housing decision due to price exhaustion.
With mounting concerns of economic instability on the horizon, the stabilization of rental rates offers a well-needed reprieve that may have the potential to reinvigorate some rental markets by motivating households who would otherwise remain in place to make the jump and move to a new home.
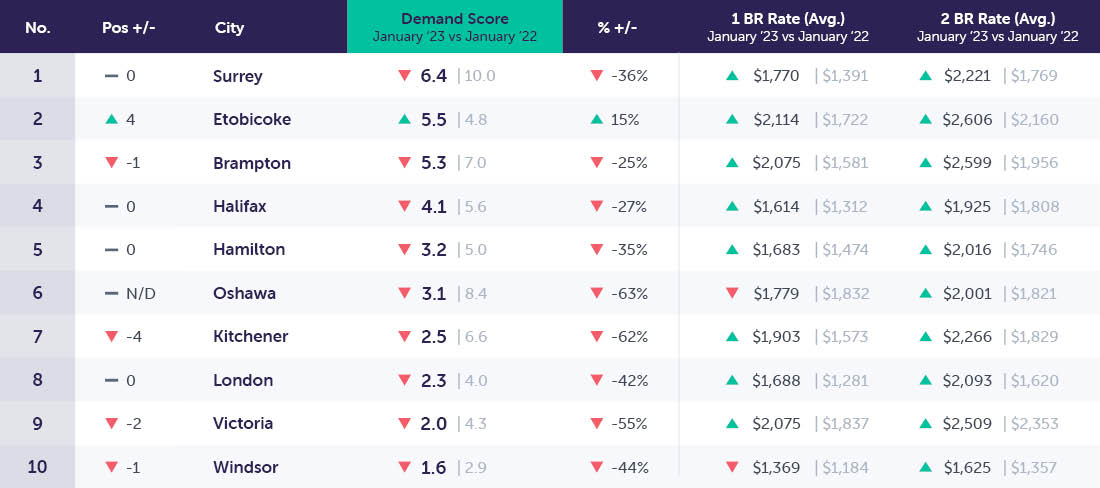
Top 10 Canadian Cities Drill Down (Y/Y): January 2023 vs. January 2022
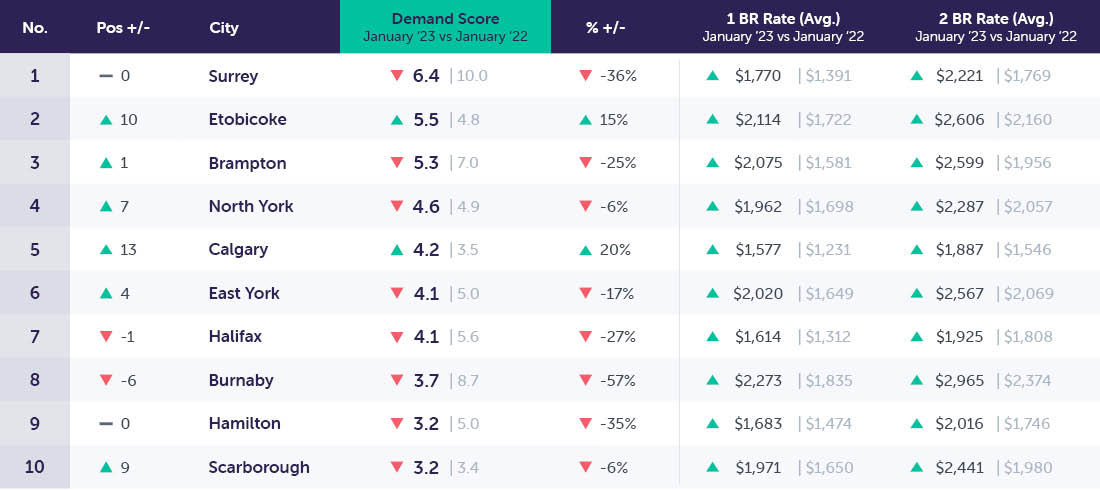
Key Trends for the Top 10 Canadian Cities in Demand (Y/Y)
Year-over-year the top 10 markets experienced a decline of -21.6% in demand scores. While demand scores are down, market fundamentals remain strong with average prospects per property up +28.7% year-over-year due to the opposite trends experienced by prospects at +12.5%, and properties declining by -12.6%. Property counts have declined so greatly due to the strong leasing trajectory experienced throughout 2022 which enabled a vast majority of available units to be leased resulting in record low vacancy rates in major markets.
An Analysis of Key Canadian Markets
To better segment our data and analyze what is happening within specific markets across Canada, we have broken down the rest of our data into 3 key market segments:
- Primary (Populations Over 600K)
- Secondary (Populations Between 600-235K)
- Tertiary (Populations Between 235-100K)
Here we will gain a deeper perspective on demand across larger population centers and trends in various markets.
Primary Markets (Populations >600K)
Primary Market Drill Down (M/M): January 2023 vs. December 2022
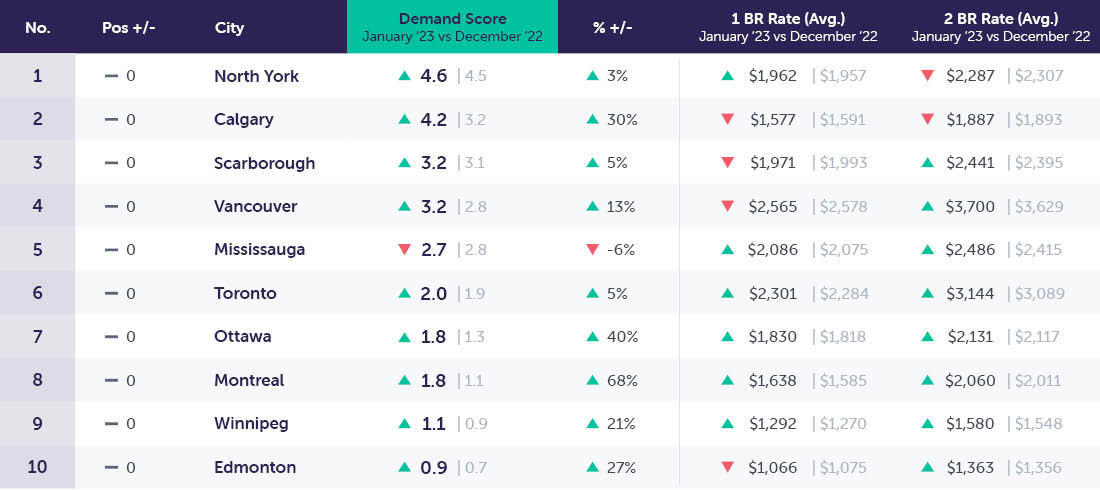
Notable Changes in Primary Markets Over The Past Month
*Overall demand scores are up +20.8% month-over-month, unique prospects are up +25.8%, and properties are up +4.2%.
Primary markets show stronger than average demand growth in January relative to the broader country. While this list of sometimes dominated by GTA markets, much of the growth this month comes from cities outside of the GTA. Most notably Montreal +68%, Ottawa +40%, and Calgary +30%. Outside of these 3 communities, the average monthly growth for primary markets sits at +9.7%. An interesting shift from the growth trends experienced throughout 2022 with Toronto proximate markets leading the charge in demand growth, now more affordable communities seem to be leading the pack in regards to growing rental demand. Whether primarily due to the availability of employment opportunities, a more affordable cost of living, or a lower housing cost Calgary, Montreal, and Ottawa will be important to watch.
Rental rates for primary markets are in line with the broader national average with a monthly change of +0.4 for both one and two-bedroom units. Rental growth will be an important factor to track over the next 2 quarters as affordability issues continue to intensify and a greater number of households chose to remain in place, foregoing a move and therefore taking themselves out of the housing market.
Primary Market Drill Down (Y/Y): January 2023 vs. January 2022
Notable Changes in Primary Market Demand Over The Past Year
*Year-over-year demand scores are down -15.5%, prospects are up +2.1%, and properties down -26.4%
By January 2022 primary markets were already in full swing experiencing a surge in new rental activity and demand as households returned to major markets after having left for most of the pandemic. This strong leasing activity persisted and resulted in this steep decline in available properties year over year. Although vacancy rates are at an all-time low, primary markets remain in a better competitive position relative to early 2022 due to the higher relative number of available prospects per available property +38.7% year over year.
Unfortunately with a return to tighter market conditions, the annual comparisons are becoming less relative as communities return to an almost frozen state with limited availability, and a fluctuation albeit maintained demand for rental apartments.
Secondary Markets (Populations ~600-235K)
Secondary Markets Drill Down (M/M): January 2023 vs. December 2022

Notable Changes in Secondary Market Demand Over The Past Month
*Secondary markets demand scores are up +14.1% month-over-month, unique prospects are up +16.8%, and properties are up +2.4%.
Secondary markets experienced the lowest resurgence in demand scores across the country as a whole. Demand as a whole varied for secondary markets with no discernable trend visible regarding what factors may have contributed to their growth or decline month-over-month. The top 3 performers in demand growth this month were Etobicoke +26%, Windsor +25%, and Oshawa +23%.
Rent growth for the top 10 secondary markets sits at half the national average at approximately +0.2% month-over-month. The more muted growth in demand for these communities is likely to play a major role in lower rent growth. Although it remains too early to tell whether this will persist in the coming months, this slowing of rent growth should offer those residents who have delayed housing decisions some comfort.
Secondary Market Drill Down (Y/Y): January 2023 vs. January 2022
Notable Changes in Secondary Market Demand Over the Past Year
*Overall, year-over-year demand scores are down -36.7%, with prospects down by -19.8%, and properties down by -22.7%.
Coming out of the holiday season demand has begun to surge however January 2022 represented a substantially different rental atmosphere in secondary markets. Although primary markets began to take a growing share of the market, secondary markets maintained substantial interest with many renters due to their greater level of amenitization, and proximity to employment centres.
Although a considerable number of renters have left secondary markets, they remain a serious contender for many renter households looking for access to major markets, while also reducing their cost of living.
Tertiary Markets (Populations ~235-100K)
Tertiary Markets Drill Down (M/M): January 2023 vs. December 2022
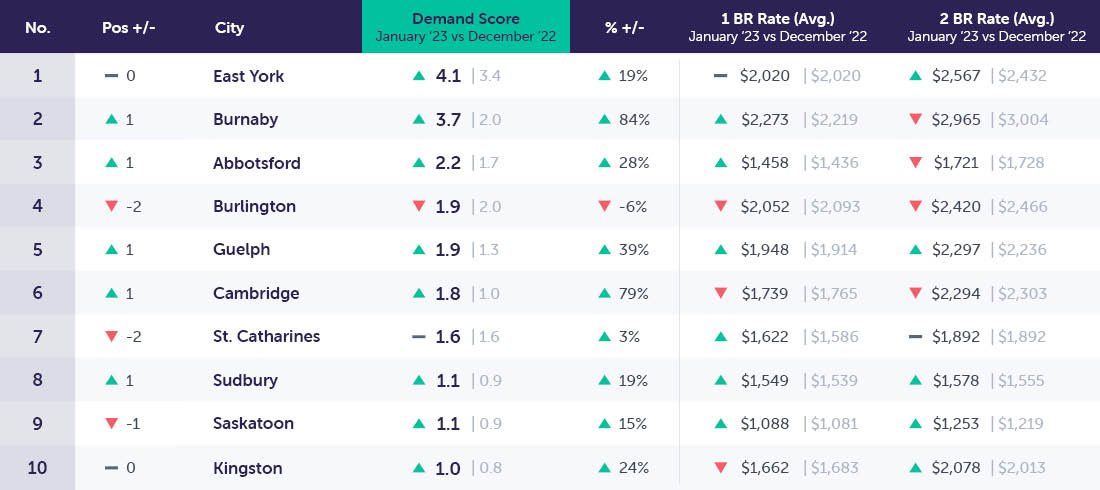
Notable Changes in Tertiary Market Demand Over The Past Month
*Demand scores in tertiary markets increased +26.5% month-over-month, unique prospects increased by +35.7%, and available properties increased by +7.3%
Tertiary markets outperformed the rest of the country in January with a strong return coming out of the holiday season. Rental rates are however a different story with several markets posting declining rental rates and an overall average of +0.2% month-over-month change. Tertiary markets have long fallen out of favour for many renters so this monthly shift in demand scores comes unexpectedly after a long period of gradual decline.
Tertiary Markets Drill Down (Y/Y): January 2023 vs. January 2022
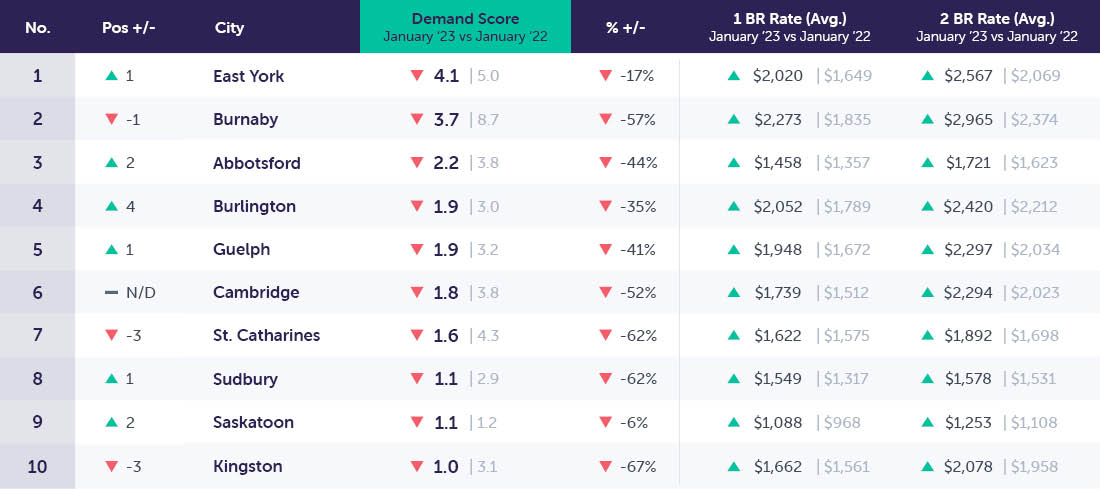
Notable Changes in Tertiary Demand Over the Past Year
*Overall, year-over-year demand scores are down by -42.7%, unique prospects are down by -14.8%, and available properties are down by -9.5%.
Much of the interest in tertiary markets was gone by January 2022 leading to a year-long decline in overall demand scores with each subsequent month experiencing a more pronounced decline in demand scores.
Regardless of the general trajectory of tertiary markets, they maintain strong fundamentals with average prospects per property only down -5.9%. This suggests that although conditions are tighter than they were at the tail end of the pandemic; the strong leasing activity they experienced throughout the past 12 months enabled them to lower vacancies and sufficiently reduce availability to account for the loss in demand.
Conclusion
In January, conventional market conditions returned after the seasonal decline, and there was a greater-than-expected resurgence of renter interest. As a result, property availability returned to pre-holiday levels, and demand scores increased significantly, by an average of 19.3%. This ongoing growth in demand has reversed the previous month's drop in average rents, with an average increase of $6 for one-bedroom units nationwide. Although this growth rate is lower than the past 12 months, it is in line with the 3 and 5-year trends of approximately 5.5% rent growth annually in many large urban centers, including Toronto.
Large urban markets have experienced the strongest growth in rental demand, with the number of prospective tenants increasing compared to the same period last year. This suggests that renters are still preferentially attracted to larger urban centers, whether due to additional renters leaving secondary and tertiary markets or new individuals entering the rental market. As such, it is expected that large urban centers will continue to dominate the rental landscape in Canada.
As we continue into 2023 it remains too early to determine where markets will go. Whether primary markets will continue to lead the pack, and whether rents will be re-invigorated. However despite the concerns around affordability, and availability; average rents are not likely to decline significantly. Due in part to the lack of supply plaguing this country, the on-going demand for rentals maintains a tight supply of units which will in turn keep average rents propped up throughout the year.
Regardless of strong demand, property owners should continuously review their approach to attract qualified tenants to fill vacancies while also protecting themselves from liabilities and the possibility of non-payment during times of instability.
To maximize incoming leads and fill available vacancies, consider booking a strategy call with Rentsync to ensure your leasing and marketing initiatives are positioned correctly.

Methodology
To present this data, Rentsync has determined three key calculations for each area of the report, they are as follows:
Demand Score: Our demand score is rated out of 10 (with 10 being the highest score a city can receive), and is calculated based on unique leads per property, per city, and compared against benchmark data.
For Example Surrey, BC received a demand score of 6.4 this month, versus 5.6 last month. Meaning Surrey experienced a +0.8 point increase in its demand score.
Demand Percentage (% +/-): This is determined according to the year-over-year (YOY) or month-over-month (MOM) increase or decrease in unique leads per property.
For Example The month-over-month demand scores in Surrey, BC went up +14% in January 2023 versus December 2022 while staying in place within our rankings as the highest-achieving market in January. The year-over-year demand score in Surrey decreased by -3.6 points representing a -36% decrease from January 2022.
Position: The position is determined by unique leads per property, with cities that have at least *20 properties or more. The position will vary depending on demand.
For Example This month, Surrey, BC maintained its top spot on our Top 40 Canadian cities in Demand rankings, and also maintained its spot from last year.
*This report provides month-over-month rental listing data for January 2023 versus December 2022, as well as a year-over-year comparison from January 2023 versus January 2022. It also outlines the month-over-month and year-over-year trends in primary, secondary, and tertiary markets.
You might also like...
Manage cookie settings
Rentsync collects cookie data to provide a better user experience, but we offer you choices regarding how we and our third party providers collect and use the cookie data.
Necessary Cookies
These are essential in order to enable you to move around the website and use its features. If you do not allow these cookies, you won't be able to use our site properly.
Targeting and Tracking Cookies
These record your visit to the Rentsync website, the individual pages you visit, the links you follow and the type of device you use. Our use of these cookies might also mean that you may see Rentsync adverts on other websites. Our partners may also use information recorded by these cookies to see how well their ads are performing. If you do not allow these cookies, you may see more content and adverts that do not match your interests.
We use cookies from third-party advertising partners to deliver relevant advertisements to you both on the Rentsync website and on other websites. To opt out of a third party's use of cookies and behavioural advertising, you must visit their website and follow the specified opt-out procedures.